
The average Islington home was worth £672,151 in September, down 4.9% in a year but up £6,144 on August. Flats fell furthest, by 5.5%.
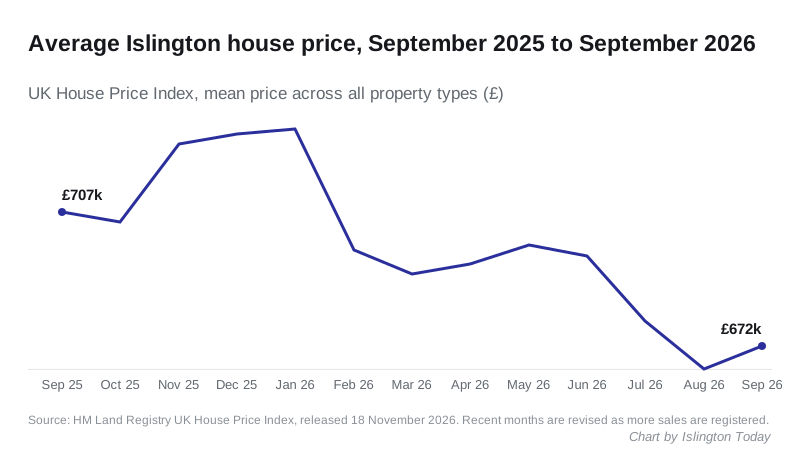
The average Islington home was worth £672,151 in September 2026. That is £34,681 less than a year earlier, a fall of 4.9%.
The month itself went the other way. Prices rose £6,144 on August, or 0.9%. It is the first monthly rise in the borough since May. London fell 1.4% over the same month.
The figures come from the UK House Price Index for September 2026, published by HM Land Registry on 18 November. September is a first estimate and will be revised.
Overview
- £672,151 average price in Islington, September 2026.
- Down £34,681 (4.9%) on September 2025, when it was £706,832.
- Up £6,144 (0.9%) on August, which is now put at £666,007.
- Flats fell furthest: down 5.5% in a year, to £557,032.
- London: £545,579, down 3.5% in a year. England: £292,998, up 0.8%.
August was the low point
The revised August figure of £666,007 is the lowest monthly average for Islington since February 2023, when the index stood at £665,837. September’s £672,151 is the second-lowest since then.
The fall from January’s £728,202 to August came to £62,195. September recovers about a tenth of that.
Flats down most
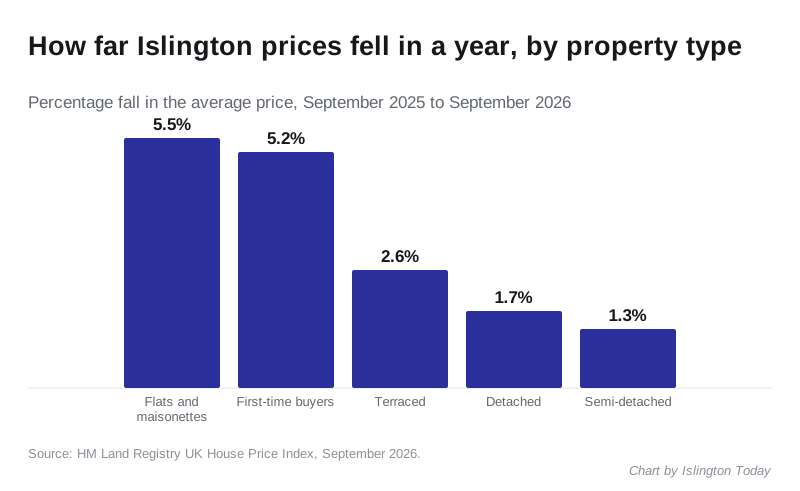
Every property type in Islington is cheaper than a year ago. The biggest falls are in flats and in the average price paid by first-time buyers.
| Property type | September 2026 | Change in a year |
|---|---|---|
| Detached | £1,685,007 | down 1.7% |
| Semi-detached | £1,413,430 | down 1.3% |
| Terraced | £1,157,306 | down 2.6% |
| Flat or maisonette | £557,032 | down 5.5% |
| First-time buyer average | £591,894 | down 5.2% |
The Land Registry calculates each type’s average separately, from its own index, so the borough figure is not a simple average of the rows above.
How Islington compares
Islington had the 12th steepest annual fall of London’s 33 local authority areas. The steepest falls were all in central and inner London.
- Westminster: down 18.5%, to £861,130.
- City of London: down 17.3%, to £663,585.
- Kensington and Chelsea: down 15.6%, to £1,170,938.
- Camden: down 10.0%, to £789,180.
Among Islington’s other neighbours, Haringey fell 5.4%, to £606,907, and Hackney 3.2%, to £630,415. Ten boroughs, most of them in outer London, rose over the year, led by Barking and Dagenham at 5.1%.
London as a whole fell 3.5%, to £545,579. England rose 0.8%, to £292,998. The borough figures are from the Land Registry’s UKHPI data for each area.
What it means for you
The UKHPI figure for Islington house prices is a mean, not a median. In a borough with flats at £557,032 and detached houses at £1,685,007, a handful of expensive sales can move it. The index adjusts for the mix of homes sold, but the most recent months are still based on fewer sales than will eventually be registered, so the first estimate often moves when it is revised.
For a buyer, the year-on-year fall is the steadier signal: prices are lower than a year ago across every type of home. For a seller, one month’s rise is not yet a recovery.
The Land Registry publishes the October figures next month.
Sources
- HM Land Registry, UK House Price Index for September 2026, published 18 November 2026.
- UKHPI monthly data for Islington, London, England and each London borough, via the Land Registry linked data API, read 18 November 2026.
Have your say