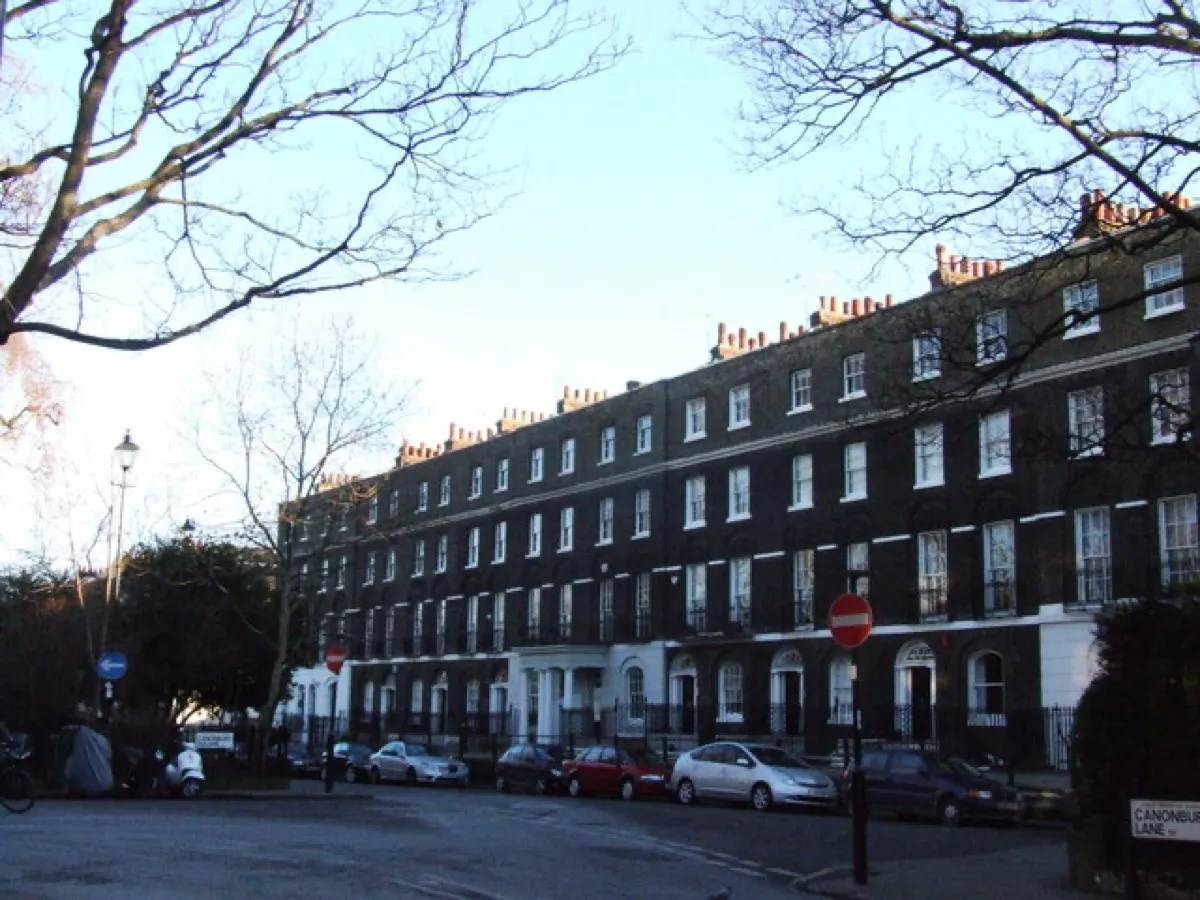

The average Islington home sold for £669,879 in May 2026, down 6.4% in a year. Flats, which are most sales here, average £557,257. Area by area, with sources.
Islington is a borough of flats. That single fact explains most of what looks odd about its house-price figures, and it is the reason a headline average here is less useful than almost anywhere else in London. The number that matters to most people buying in N1, N5, N7 or EC1 is not the borough average. It is the flat price, and that has fallen harder than anything else in the past year.
This page uses the official UK House Price Index, which is built from completed HM Land Registry sales rather than asking prices, plus Rightmove’s neighbourhood sold-price records for the area detail.
The headline figure
The average home in the London Borough of Islington sold for £669,879 in May 2026. That is down 6.4% over the year, one of the sharper falls anywhere in the country at a time when England as a whole was up 2.3%.
Two things are happening at once. Islington sits at the flat-heavy end of the London market, and flats are the property type that has softened most across the capital since mortgage rates rose. It is also a small, expensive market where a handful of large sales move the average: the Land Registry recorded just 98 sales in the whole borough in March 2026, against 4,199 across London.
What it means for you. If you are selling a flat, the market is not where it was in 2024 and pricing to the 2023 comparables will cost you months. If you are buying, this is the first sustained period in a decade where a patient buyer in Islington has genuine room to negotiate.
Prices by property type
The spread between a flat and a house in Islington is roughly a factor of two, and it is where the borough average comes from. These are the May 2026 figures from the UK House Price Index:
| Property type | Average price | Change over 12 months |
|---|---|---|
| Flat or maisonette | £557,257 | −7.0% |
| Terraced house | £1,133,274 | −4.4% |
| Semi-detached house | £1,391,136 | −4.2% |
| Detached house | £1,670,644 | −3.1% |
| All types | £669,879 | −6.4% |
Detached houses barely exist in Islington, so treat that £1.67m figure as a handful of transactions rather than a market. The two rows that describe the borough as most people experience it are the flat at £557,257 and the terrace at £1,133,274, and the gap between them is the whole story of moving up here.
First-time buyers and movers
A first-time buyer in Islington paid an average of £592,265 in May 2026, down 6.5% over the year. A home mover paid £838,700, down 5.8%. The first-time-buyer figure sits close to the flat average, which is what you would expect in a borough where the entry point is a one or two-bedroom flat rather than a starter house.
Area by area
The borough average hides a spread of roughly £270,000 between its cheapest and priciest neighbourhoods. These are Rightmove’s overall averages for all sales in the last year, which cover a neighbourhood rather than the whole borough:
Comparing the flat price is the fairer test, because it strips out how many houses happen to sit in each area:
| Area | Average flat | Average terraced house | Overall, year on year |
|---|---|---|---|
| Clerkenwell | £729,445 | £1,946,000 | 14% down |
| Barnsbury | £664,731 | £1,838,343 | 6% down |
| Canonbury | £656,826 | £1,953,463 | 2% down |
| Highbury | £625,183 | £1,738,613 | 5% down |
| Tufnell Park | £568,270 | £1,474,246 | 9% down |
| Archway | £556,308 | £1,121,581 | 10% up |
| Finsbury Park | £553,279 | £1,196,292 | 2% up |
| Holloway | £543,426 | £1,233,679 | 9% down |
Two results stand out. Clerkenwell is the most expensive place in the borough to buy a flat and the fastest-falling, down 14% over the year and 24% below its 2020 peak. It is the part of Islington most exposed to the office-district market: small, expensive, warehouse-conversion flats bought by people who wanted to walk to work in the City.
Archway is the only area up by a double-digit margin, 10% over the year and now 5% above its 2023 peak. Its flats are the second cheapest in the borough and its houses are by some distance the cheapest, which in a falling market is exactly the profile that holds up. Finsbury Park is the other area up over the year, by 2%.
How Islington compares
| Area | Average price | Change over 12 months |
|---|---|---|
| Islington | £669,879 | −6.4% |
| London | £544,814 | −3.7% |
| England | £292,095 | +2.3% |
An Islington home costs roughly £125,000 more than the London average and 2.3 times the England average. It is also falling while England rises, and falling faster than London as a whole. That gap between Islington and the national picture is not a market-wide slump; it is the flat market and the central-London flat market in particular.
Two traps in Islington price figures
The postcodes do not match the borough. None of Islington’s eight main outcodes sits wholly inside it. N1 runs into Camden and Hackney, N4 into Hackney and Haringey, N5 and EC1V into Hackney, and N7, N19, EC1R and EC1M into Camden and the City of London. Any figure quoted for “N1” or “EC1” includes sales in neighbouring boroughs, which matters if you are checking which council you will be paying, or looking up a planning history, rather than just comparing a price.
Neighbourhood averages are not borough averages. Rightmove’s “Islington” area covers the N1 core around Upper Street and Angel, not the whole borough, which is why it reads £801,094 against the Land Registry’s £669,879. Both are correct. They measure different places.
Frequently asked questions
What is the average house price in Islington?
£669,879 in May 2026, according to the UK House Price Index built from completed HM Land Registry sales. That covers every property type across the borough, and the borough is mostly flats.
Are Islington house prices going up or down?
Down. Prices fell 6.4% in the year to May 2026, with flats down 7.0%. That is a steeper fall than London as a whole, which was down 3.7%, and it runs against England, which was up 2.3%.
How much is a flat in Islington?
£557,257 on average in May 2026. By neighbourhood it ranges from about £543,000 in Holloway to about £729,000 in Clerkenwell.
What is the cheapest part of Islington to buy in?
On overall average sold price over the last year, Holloway at £665,170, followed by Finsbury Park at £690,695. Archway has the cheapest terraced houses, at an average of £1,121,581.
How much does a first-time buyer pay in Islington?
An average of £592,265 in May 2026, down 6.5% over the year. That is close to the borough’s average flat price, which is what most first purchases here are.
Where can I check what a specific house sold for?
Every completed sale in England and Wales is public. Look up a street or a single address free on the HM Land Registry Price Paid service.
Related
- Islington Tube and train times: the zone your station is in, which is what the fare and a good part of the price depends on.
- Islington planning news: the borough’s housing target, and what is actually being built.
- Things to do in Islington: what you get for the money.
Sources
- UK House Price Index, Islington (ONS and HM Land Registry) for the borough average, property-type and buyer-type figures. Figures retrieved from the Land Registry linked-data service for May 2026 on 9 August 2026; sales volumes are for March 2026, which is the most recent month published.
- Rightmove Islington sold prices and its neighbourhood pages for Canonbury, Barnsbury, Highbury, Clerkenwell, Archway, Tufnell Park, Finsbury Park and Holloway, checked 9 August 2026.
- HM Land Registry Price Paid search to check an individual address.
Land Registry figures are provisional and revised as more sales complete. Check the latest numbers against the linked sources before you rely on them.
Have your say